Monitoring and costs
Breakdowns from overall consumption to individual equipment, demand profiles and cost analysis. Tariff information depends on the market and available data.
SERVICES
Submeter brings consumption, equipment and facilities together to show what is happening and help decide where to act.
Explore ↓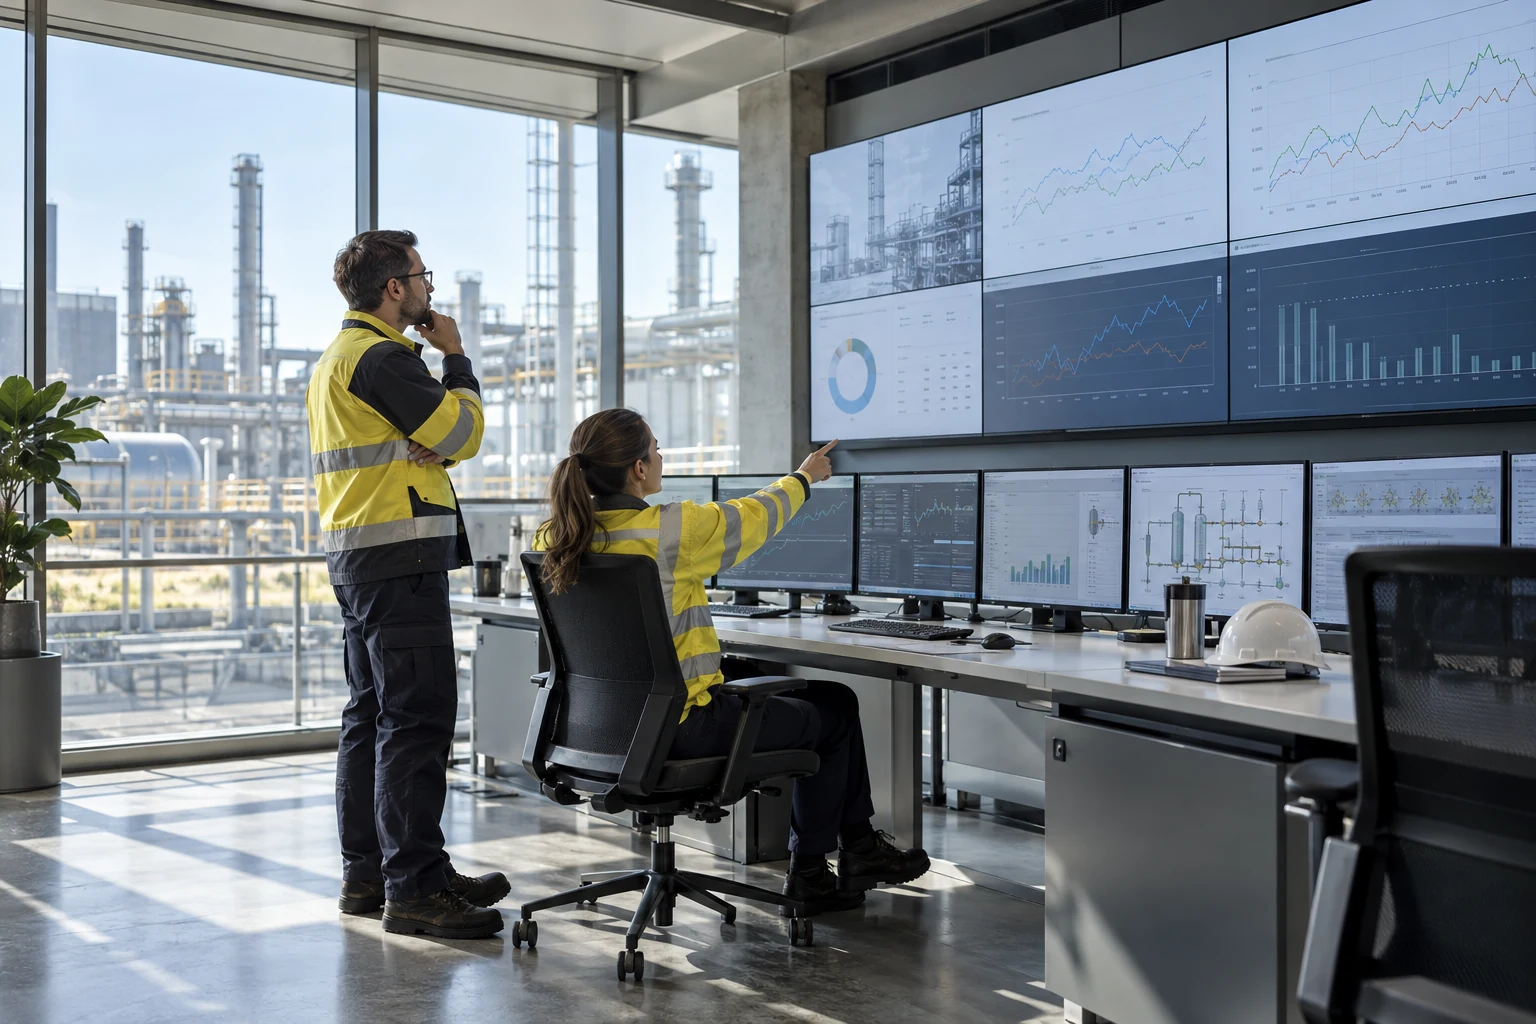
DIGITALISATION WITH SUBMETER
Digitalisation connects what happens in your facility with daily decisions. With Submeter, we structure data so your team can locate deviations, compare them and decide where to intervene.
How we work with you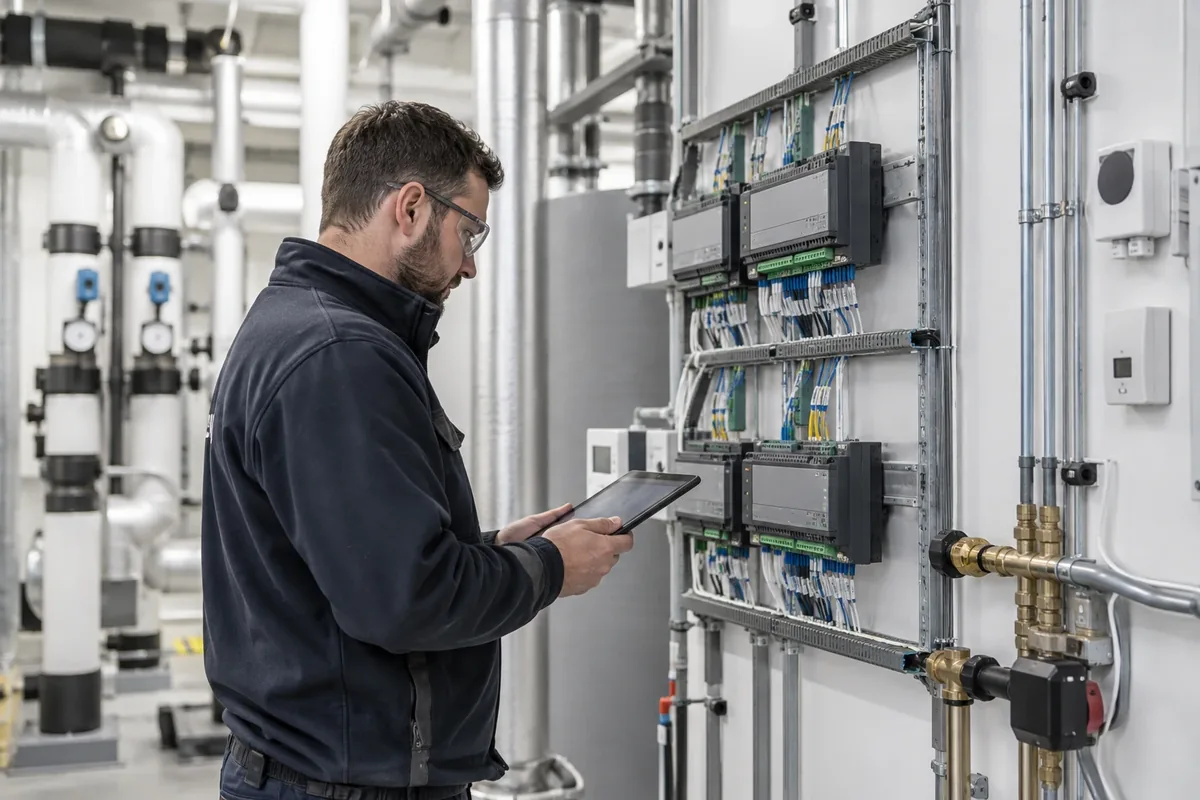
01Connect
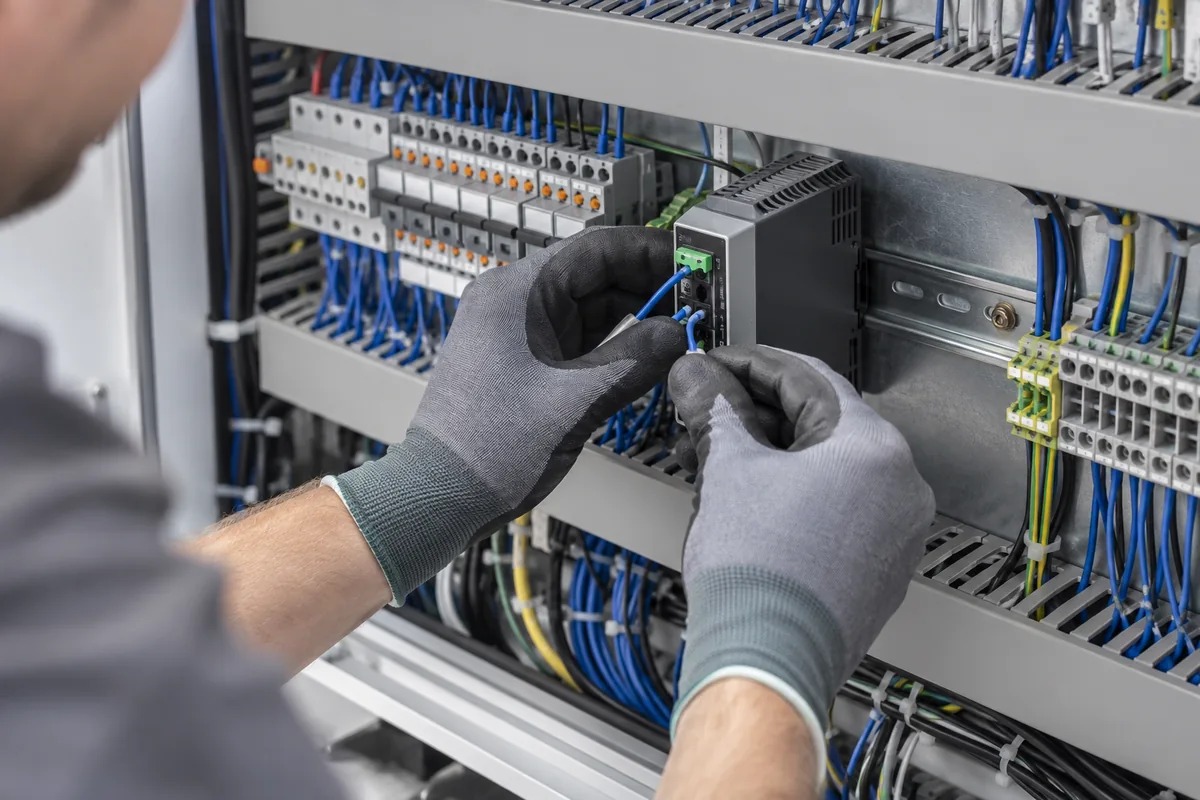
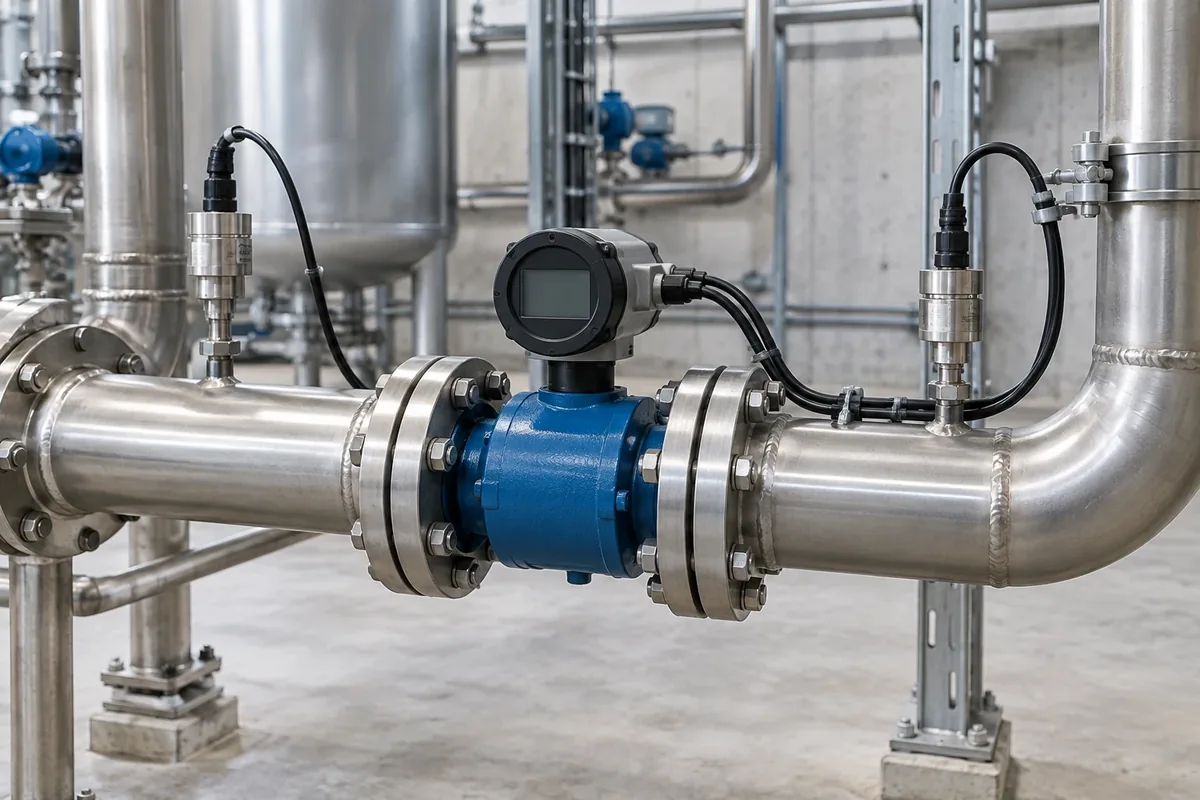
We review existing meters, sensors, communications and systems. Integration is designed around that reality and the questions your team needs to answer.
An integration map suited to the facility.
02Organise
Submeter relates consumption to sites, areas and assets. Units and readings are reviewed to build indicators that support meaningful comparison.
Information organised by facility and asset.
The journey of a reading.
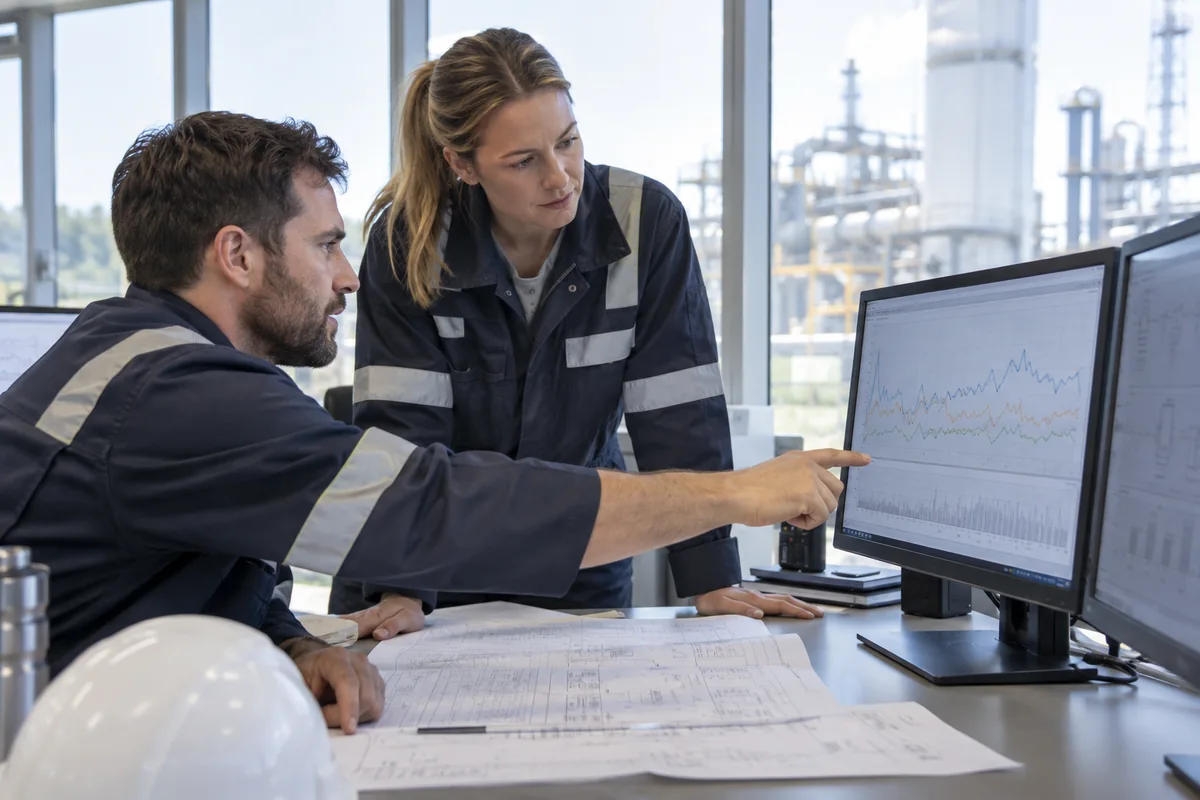
The overview shows when consumption changes. System-level detail helps locate where to investigate. Schedules and operating conditions explain whether that change makes sense.
Explore the Submeter demokW · kWh · m³ · °C
Units · schedules · quality
Profiles · comparisons · indicators
Investigate · prioritise · verify
03Act
Dashboards, comparisons and reports support operational review. Alerts are defined with context and owners to guide the investigation of deviations.
Shared indicators and a way to act on them.
THE THREES APPROACH
Our in-house energy management and optimisation platform brings together electricity, water, gas and fuels. Its vendor-agnostic approach supports integrations tailored to existing instrumentation and systems.
Breakdowns from overall consumption to individual equipment, demand profiles and cost analysis. Tariff information depends on the market and available data.
Compare facilities and equipment, report consumption and visualise flows to identify differences and guide investigation.
Detect unusual patterns and apply predictive energy and cost analytics, subject to data quality and availability. Alerts support review by the operations team.
Connect instrumentation and systems such as SCADA or ERP through available interfaces. Temperature, humidity or air-quality readings can add context where suitable sensors exist.
DIGITAL TWIN ENERGY MANAGEMENT
A digital twin connects representations of buildings and assets with operational information. Navigate facilities, areas and equipment to interpret consumption and environmental conditions in a spatial view.
We work on new projects—defining measurement points from design—and existing facilities, where instrumentation and available data are assessed.
CH-01
AHU-02
P-03
Explanatory example with simulated values. No connection to a real facility.
Distinguish instantaneous load from accumulated consumption.
Identify missing or inconsistent readings before analysis.
Compare periods with production or occupancy context.
Relate deviations to how the equipment is actually used.
TAILORED TO YOUR FACILITY
Connect production lines, compressed air and auxiliary services with site consumption.
Provide visibility into HVAC, thermal production and utilities in continuous operations.
Compare areas, schedules and HVAC systems to investigate consumption deviations.
YOUR STARTING POINT
For a useful first conversation, share:
Meter inventory, existing management systems, communication availability and the questions your team needs to answer.
Let’s discuss your projectThe overview shows when demand changes. A breakdown by system narrows the investigation; schedules and operating conditions provide context. The demonstration dashboards show this process using simulated data.
We review equipment, protocols and available data to define a feasible integration. Scope is agreed for each facility.
The website demo lets you explore a factory, shopping centre, hospital and data centre. These scenarios use simulated data.